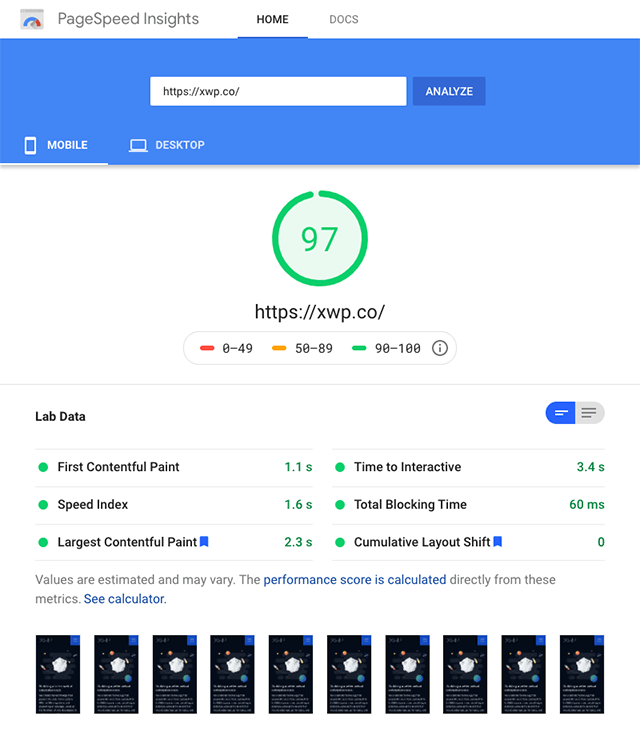
Page performance is a key aspect of maintaining a successful website. But what exactly does performance mean in this context, why is it important, and what benchmarks can you use to measure it? Luckily, we have Google to help us out.
In one of their earlier Lighthouse updates, Google released Core Web Vitals, a system that developers could use to measure website speed and performance. These scores measure a variety of user experience benchmarks, but three carry the most weight when it comes to how fast your site actually is:
Largest Contentful Paint, Time to Interactive, and Cumulative Layout Shift.
These metrics can give you a pretty good idea of what kind of an experience a user is having on your site. And, since June 2021, Google has considered them an integral part of your search ranking. Your keyword game could be on point, but if your site doesn’t perform, you can kiss your dreams of page one goodbye.

Core Web Vitals – Determiners of PageSpeed Insights
When you first go to Google PageSpeed Insights and input your URL, you’ll see a number of different bars and charts. All of these things relate to the performance and user experience of your site, but they are not equally impactful on your overall score.
To understand why they are weighted differently, it’s important to understand that there are three factors that most heavily influence global user experience: Loading time, interactivity, and layout stability. You can learn more about why these are so crucial to your user experience in our article ‘The Role Performance Plays in User Experience.’
Because of this, Largest Contentful Paint, First Input Delay, and Cumulative Layout Shift metrics are considered the most significant when it comes to judging your overall score and ranking, and for most, should be the primary focus for your improvements.
To learn more about how performant user experiences can help to smash through targets and improve KPIs, read our article 15 Ways User Experience Impacts Business Success.

Largest Contentful Paint (LCP)
Largest Contentful Paint (LCP) represents the amount of time it takes before a page’s main content has loaded. While some metrics like Speed Index and First Meaningful Paint illustrate the bigger picture when it comes to a site becoming usable, they do not take a “user-centric” approach to page performance. Largest Contentful Paint helps analysts understand (roughly) when a user can see the biggest part of the content during the loading of a page.
How Is LCP Score Determined?
PageSpeed Insights determines a page’s LCP score by looking at when in a page’s load cycle certain elements are loaded, including:
- <img> tags
- <image> tags inside <svg> tags
- <video> tags
- Background images loaded using the function url() instead of CSS gradient
- Text nodes or inline text elements inside block-level elements
- And much more
What Should Your LCP Score Be?
LCP is rated on a scale of how many seconds it takes a page to load. If a page’s LCP occurs within 2.5 seconds, the page is rated “Good.” If a page’s LCP occurs between 2.5 and 4.0 seconds, it “Needs Improvement.” And if a page’s LCP occurs after 4.0 seconds, it’s scored as “Poor.”
For a full explanation of why that 2.5-second boundary is so important, check out our article ‘Largest Contentful Paint — The Moment of Truth‘ from our performance engineer, Sabrina Zeidan.

First Input Delay (FID)
Interactivity is one of the most important factors when it comes to creating “user-centric” websites, but it can also be one of the most complex. If a user clicks on a link, button, or some other javascript-created control, they expect an almost instantaneous reaction. First Input Delay (FID) measures how long it takes for a site to respond to a user’s action.
How Is FID Score Determined?
In order to fully understand FID, and how we calculate it, we first have to cover a few other important page performance indicators: Time to Interactive (TTI) and First Contentful Paint (FCP).
- FCP is a calculation of when the first instance of content is loaded on the page.
- TTI, on the other hand, measures how long it takes for the DOM to completely load and when a user can completely interact with the page.
- Speed Index is a metric that blends all of the metrics, attempting to find an average that describes (roughly) how fast your site feels to users with a single number.
Why Don’t We Use TTI to Measure User Interactivity?
TTI is a measure of absolute or ‘true’ performance, but when it comes to user experience, we actually care a lot more about perceived performance. When we’re fine-tuning for user success, It’s less important how fast a page actually loads, but instead how fast the user thinks a page has loaded.
Of course, true performance is still important. But ideally, we want users to think your website has loaded with lightning pace, even if there are things still happening behind the scenes. Learn more about the different types of performance and how it informs our workflow in our article ‘The Four Pillars of Website Performance’.
Understanding FID
We can use FCP as an indicator of when a page begins to load, and we can use Speed Index to give us a snapshot of the “speed” content is displayed. But this doesn’t tell us anything about when users are able to interact with on-page elements, and TTI, while useful in judging “real performance”, isn’t so useful for judging perceived performance.
FID is the important missing link between these metrics, allowing us to understand what a user would experience when actually on the site: A Measure of the time between a user’s first interaction on a page (clicking a button or a link) and when the browser responds and performs the intended function. In simple terms, First Input Delay tells us how long a user had to wait for a response from the interface after their first click.
Improving Your Site’s FID
In automated testing, we often use “Total Blocking Time (TBT)” as a starting point, which is a comparable metric that looks for hefty JavaScript. While related to FID, TBT does not consider interactivity. Instead, it looks for what scripts and functions are loading while building the page. The test looks for all instances when scripts slow down the device.
Both TBT and FID measure a page’s unresponsiveness: TBT looks for all script loading, whereas FID focuses on interactivity. We can simulate a click on a page to generate a lab metric for FID, but it’s incomplete as a metric of performance. This is because device type, CPU speed, RAM memory allotment, and browser version all slightly impact the TBT and FID score. Because of this, it will not perfectly line up with real user experience.
Because of this, we suggest using more than just lab data (e.g. testable in a single session) to inform your performance strategy. What this usually means is considering the field data (e.g. what your real users see) from either the PageSpeed Insights report, or, for more granular details, the Chrome User Experience Report (CrUX) which records actual users’ experience and surfaces this to the site admin.
What Should Your FID Score Be?
FID scores are measured in milliseconds. If a page’s FID occurs before 100ms, then the page is rated “Good.” If a page’s FID occurs between 100 and 300ms, it “Needs Improvement.” And if an FID occurs after 300ms, then the score is “Poor.”

Cumulative Layout Shift
Cumulative Layout Shift (CLS) measures the visual stability of a page as it loads. Have you ever been on a page getting ready to click a button, when suddenly the page loads an image, or another script that causes the button to move a couple of dozen pixels above or below where it was before?
It’s one thing if a page is still loading and it’s obvious that things are still in progress, but when something dramatically changes, it confuses (and irritates) users, often preventing them from clicking on the “cancel” button or reading the headline they came to see.
This is called layout shift, and it’s a serious problem when it comes to website development and user-centric design. CLS is a measurement of all unexpected layout shifts on a page. While it’s usually preventable, it’s not usually noted unless it’s a problem. CLS is a major part of the friction that users experience on the web, which drives away users from the site they were just on and to a competitor.
How Is CLS Score Determined?
CLS score is determined using the Layout Instability API. This API searches for visible elements that change start position within the viewport. The elements which account for the largest repainted areas are then reported back to the API as “layout shift.”
Did you know? Sometimes the cause of these movements can be a small element that gets added later above them, so don’t point your finger at the big things straight away!
The API then looks at the viewport and determines how much the element has shifted within its frame. This value, known as the “distance fraction”, is expressed as a percentage between 0 and 1. The impact fraction, the second part of the layout shift equation, is determined by looking at two separate frames within the viewport. The API gauges how much an element has moved between the two frames within itself. Again, this number can range between 0 and 1.
To determine a page’s full CLS score, multiply the impact fraction by the distance fraction.
What Should Your CLS Score Be?
If a page has a CLS score of .1 or below, the page is rated “Good.” If a page has a CLS score of .1 to .25, the page “Needs Improvement.” If a page scores .25 or above, the page is rated “Poor.”
Remember that CLS is a cumulative score of all layout shifts on a page, so while there may only be three elements on a page that shift, if their individual scores add up to more than .25, the page will score poorly.
The User-Centric Model
While Google and other search engines have changed a lot over the years, this addition of ranking pages based on their user-friendliness and experience is here to stay. Search engines are competitive and are focused on delivering the best results for any given search query.
As Core Web Vitals are directly measurable statistics you can gather to understand what’s impacting the visitor metrics, it’s something you want to get as close to perfect as possible.
Ensure you’ve addressed as many technical variables as you can. If your organization’s mission, content, or product is truly the best (or the best value), having a solid technical foundation and caring about Core Web Vitals (as well as the rest of your technical infrastructure) will ensure you’ve got no surprise variables negatively impacting your success.
Page speed is one of the biggest factors affecting page ranking today, and as the technology for measuring user experience continues to evolve, pages designed with users in mind will continue to be prioritized over those that don’t.
For more performance best practices, check out our article “How to Build a Rocket: Best Practices for Better Website Performance”
How Do You Improve Your Web Vitals Scores?
The great thing about PageSpeed Insights is that users are given tons of information on LCP, FID, and CLS. But simply knowing what Core web Vitals are, and being able to make the necessary optimizations are two very different things.
This is where having a reliable performance-minded partner is crucial to success.
Since 2018, our team has been working to build a more performant web, one site at a time.
Through years of experience, we’ve developed a unique approach to pinpointing performance improvements that can have a meaningful impact on your business goals. Check out our work, and learn more about how we worked with Homebase, Nova Entertainment, and American Traveler to improve their CWV metrics, helping them boost visibility and smash their KPIs.
If you’re ready to start putting the user first and turn your website into a performance powerhouse, learn about our services or contact XWP today.


